Charts with a Coordinate Grid
Each worksheet has 6 problems
Student Objectives
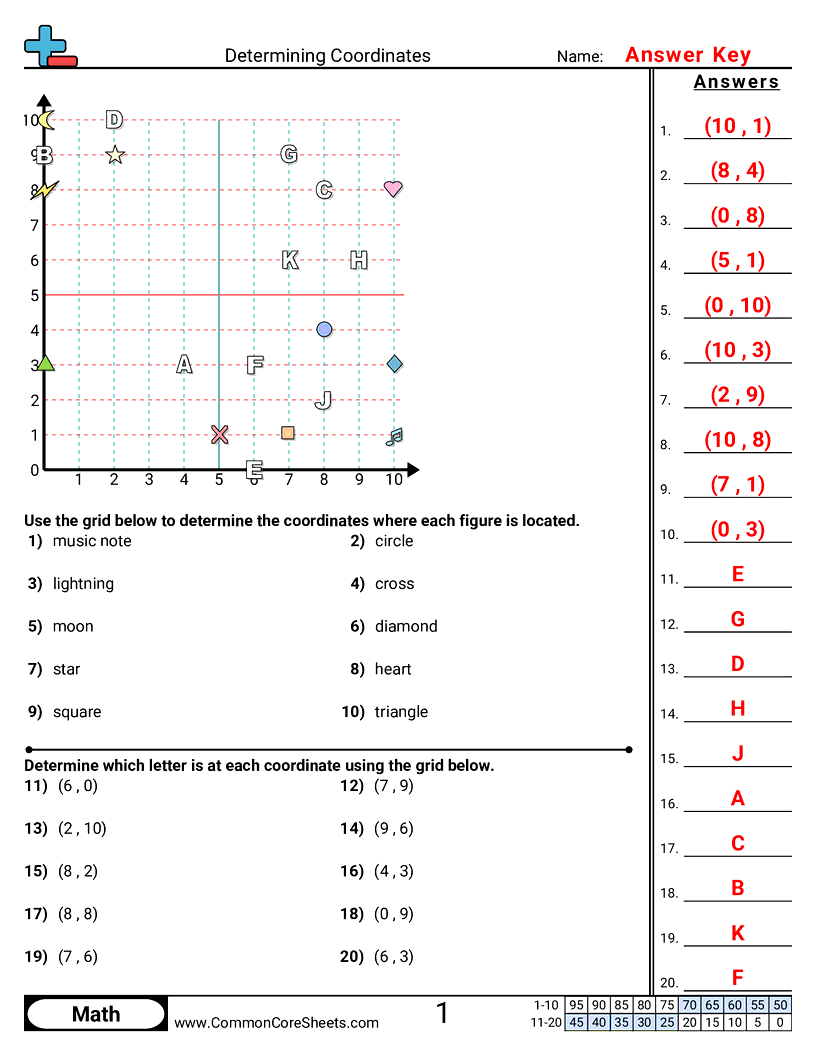
- Read and understand points shown on a coordinate grid using x- and y-values.
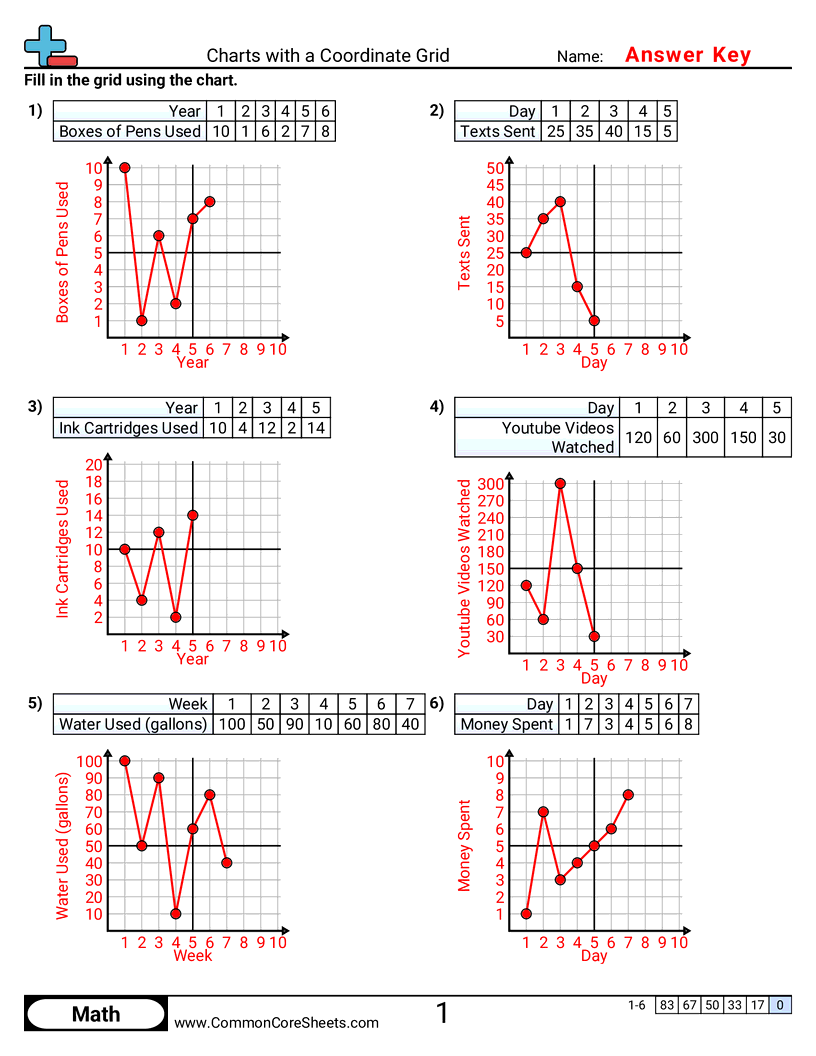
- Plot points on a coordinate grid when you are given ordered pairs like (x, y).
- Use a table or chart of x- and y-values to place points correctly on the grid.
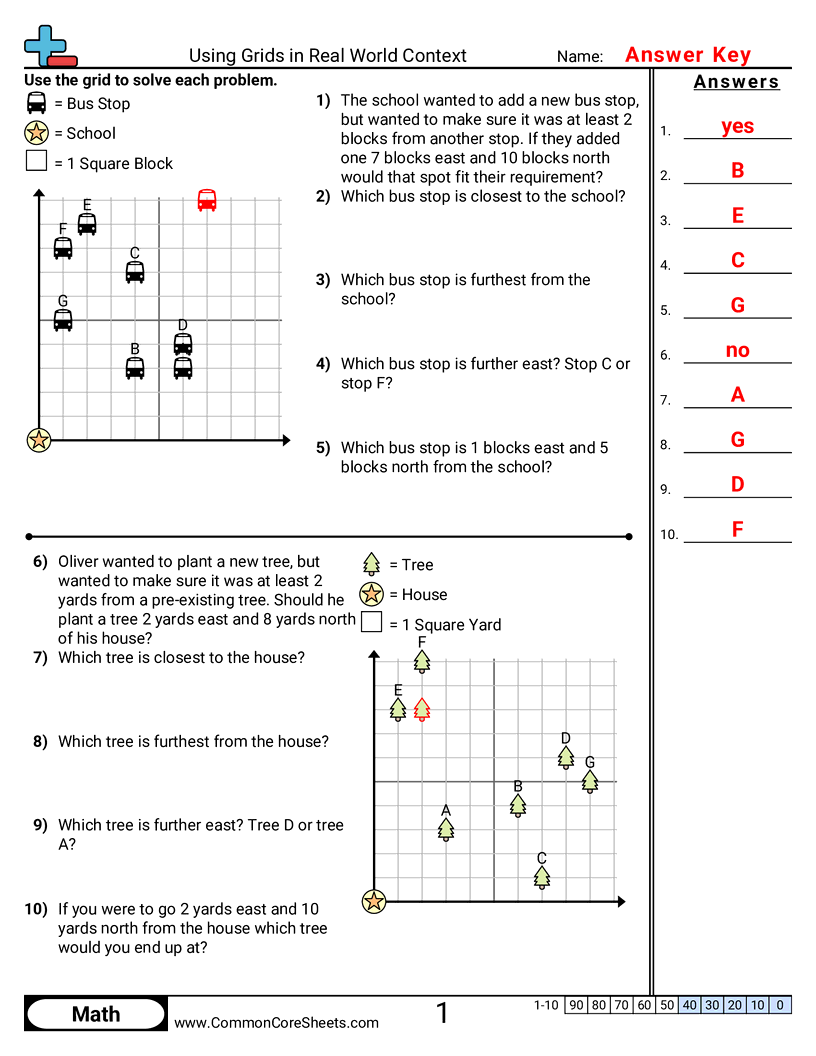
- Answer questions about where points are located by using the horizontal and vertical axes.
Tags
Standards